See what small, steady buys turn into.
Free calculators with real historical prices. Ask a question, get a plain answer.
Real monthly S&P 500 prices, dividends reinvested, no fees. Jan 2015 to Sep 2026. Not investment advice.
Real monthly Bitcoin prices (Coinbase data starts Aug 2015), no fees. Aug 2015 to Oct 2026. Not investment advice.
Real monthly gold prices per ounce, no fees. Jan 2015 to Sep 2026. Not investment advice.
Every money question, one tap away
Pick a topic. Each one opens a set of calculators built around the same idea: show the real numbers, then help you start.
All 46 calculators →Watch steady buys compound
Pick an amount and an asset. See what it became with real prices, including the bad years you would have bought through.
See all grow calculatorsSettle the classic debates
Lump sum or spread it out? Weekly or monthly? Wait for the dip? Test each one on decades of real data.
See all compare calculatorsFind your number
From lean to fat, see how much you need and how many years your monthly buys take to get there.
See all retire early calculatorsStack sats, or gold, without the stress
Recurring Bitcoin and gold buys since any date, with every crash shown honestly, plus what fees do to small buys.
See all crypto & gold calculatorsSmall habits, big numbers
Turn coffee, raises and spare change into a plan, and see what starting today is worth.
See all everyday money calculatorsHow a fat stack gets built, one boring buy at a time
- 1Pick an amount you won't miss$25, $50 or $100. What matters is that you keep doing it.
- 2Put it on autopilotMost apps run recurring buys with fractional shares. Our guides show how.
- 3Keep buying through the dipsDown months buy more shares for the same money. That's the whole trick.
Made for sharing
Learn the words
Short, plain-English explainers. Each one ends with a calculator to try it.
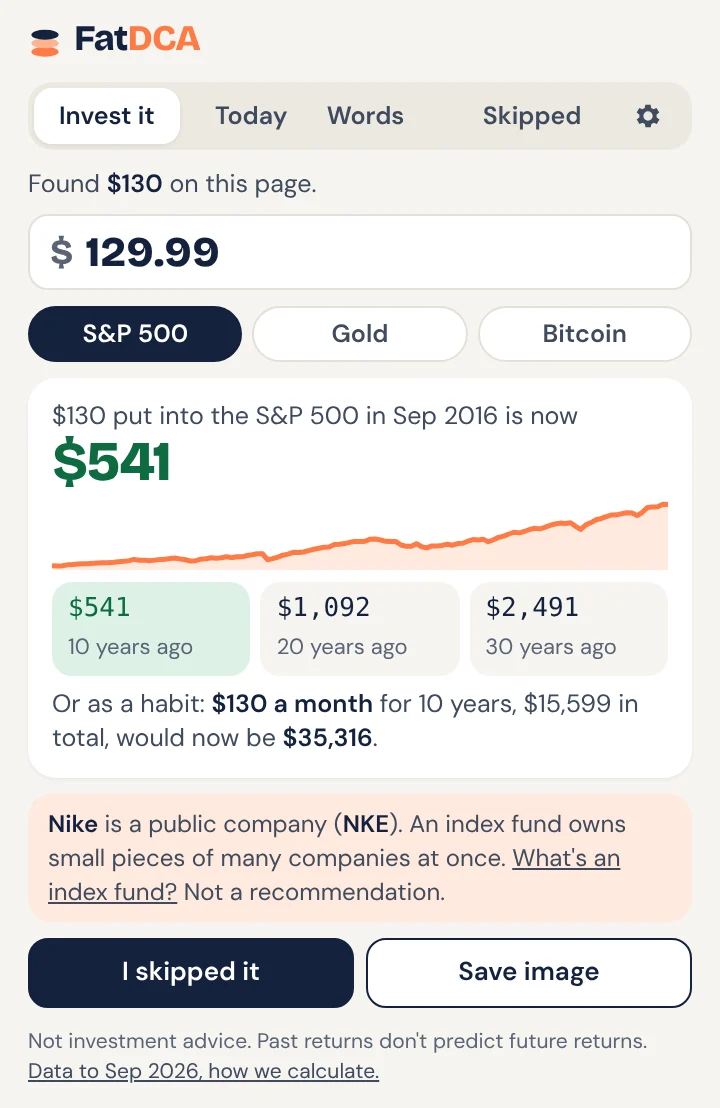
Ready to make it real?
Step-by-step guides for setting up recurring buys on the apps people actually use.